AI API observability connects a customer operation to the model requests, routing decisions, execution time, usage, errors, and product outcome behind it.
That connection matters because a successful API response does not necessarily mean the customer received a useful result.
A video request can be accepted while the generation remains queued. A language-model response can arrive with an invalid structure. A fallback can hide a primary-path outage while increasing latency and cost. A completed generation can still fail during download or application processing.
Conventional request monitoring captures part of this story. Production AI systems need enough evidence to explain the entire operation.
The practical goal is straightforward: given one customer operation, determine what ran, where time was spent, what it consumed, and whether the result met the product’s requirements.
This guide explains how to build that connection without turning every prompt, output, and identifier into an expensive or sensitive telemetry record.
Before You Read
These articles explain the workflows this guide will instrument:
For product context, the Token360 API documentation introduces its model access and usage capabilities.
AI API Observability at a Glance
Use these signals together. Each answers a different question.
Start With an Internal Operation ID
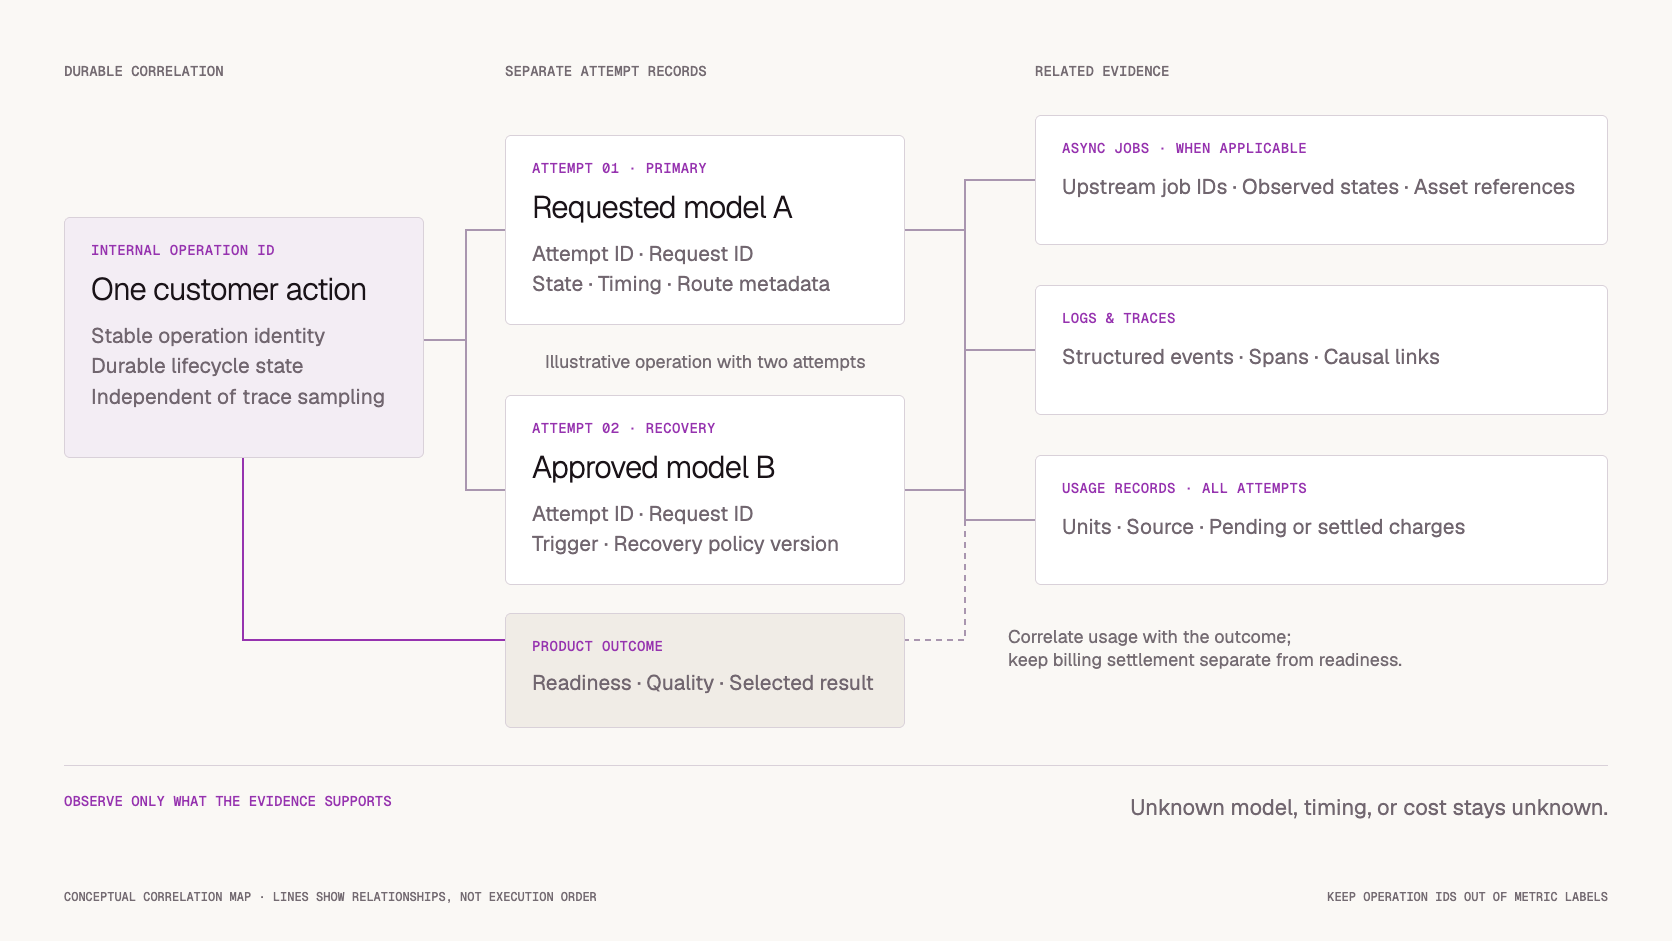
Create an internal operation ID when the application accepts a customer action.
Keep that identity stable through model selection, retries, asynchronous processing, retrieval, and final publication.
Store upstream identifiers alongside it rather than replacing it.
A single operation may contain several attempts. A batch request may contain several operations. An asynchronous operation may span several traces.
Do not force these relationships into a one-to-one mapping.
Propagate correlation data through your own queues and records. Forward metadata to external services only through supported fields and according to your data-handling policy.
An internal ID helps connect evidence. It does not, by itself, provide upstream idempotency or prevent duplicate work.
Keep Operation State Separate From Attempt State
An attempt can fail while the overall operation succeeds through an approved fallback.
The reverse is also possible: an inference attempt can complete successfully while the application fails to validate, download, or deliver its output.
Track both levels.
Attempt-level state
Capture submission status, request identifiers, reported model information, execution outcome, and error classification.
Represent unknown acceptance explicitly. A submission timeout should not automatically become “generation failed.”
Operation-level state
Track whether the customer-facing result is pending, ready, failed, canceled, or unresolved under your application’s state model.
Keep output readiness, quality acceptance, and billing settlement as separate fields when they can occur independently.
For example:
{
  "operation_id": "op_example_042",
  "attempt_id": "attempt_02",
  "workload": "video_preview",
  "requested_model": "approved-model-b",
  "reported_model": null,
  "upstream_job_id": "job_example_123",
  "attempt_state": "completed",
  "output_state": "retrieval_pending",
  "quality_state": "not_evaluated",
  "billing_state": "pending",
  "routing_policy_version": "routing-v4"
}
This is an illustrative application record, not a Token360 API response or an OpenTelemetry attribute schema.
Leaving reported_model unknown is more accurate than copying the requested model into a field that implies independent confirmation.
Define Timing Boundaries Before Building Charts
A chart labeled “model latency” is useful only if everyone understands what it measures.
For AI workloads, separate the stages you can actually observe.
Provider execution time requires evidence from the provider. If queue start and execution start are unavailable, do not split an observed interval into invented components.
Polling also affects measurement. If a job finishes between status reads, the first observed terminal timestamp is later than its actual completion.
Record provider-reported timestamps separately from application-observed timestamps, including their source. Synchronize clocks across services and use monotonic clocks for elapsed durations within a process where possible.
Match timing to the product
For interactive text, users may care about both first useful output and total completion time.
For video generation, waiting and asset preparation can dominate the experience.
For an offline batch, the relevant measure may be whether all required items finish by a scheduled deadline.
Build Metrics Around Customer Operations and Attempts
Request counts alone can become misleading once retries and fallbacks are active.
Track operation volume and attempt volume separately. Their relationship shows how much additional work recovery is creating.
A useful starting set includes:
Use bounded dimensions such as workload class, endpoint family, approved model identifier, environment, and policy version.
Even model and policy labels need lifecycle management if their values change frequently.
Keep raw user IDs, operation IDs, request IDs, prompts, and generated URLs out of metric labels. Use access-controlled search in logs or operation records for those identifiers.
Hashing an identifier does not reduce its number of distinct values. It also does not automatically make the underlying data anonymous.
Use Logs for Events and Traces for Execution Relationships
Structured logs should capture meaningful transitions with a predictable schema.
Examples include:
Preserve the error category and a sanitized underlying error code. Avoid writing raw exceptions or response bodies without checking what they contain.
Traces help connect related units of execution. Instrument the stages you control, including routing, outbound calls, queue handling, and post-processing.
Represent asynchronous relationships honestly
A job can outlive the HTTP request that submitted it.
Use propagated context when a parent-child relationship is appropriate. Use span links when separately traced work needs a causal association, such as a later queue consumer. OpenTelemetry documents this use of links in its tracing concepts.
An external provider may not expose internal spans. In that case, your client span measures an observed external call; it does not reveal how the provider divided its time.
The durable job record must remain usable when a trace was not sampled or has expired.
Version instrumentation deliberately
OpenTelemetry’s GenAI semantic-convention guidance now points to a dedicated repository.
Record the convention and instrumentation versions you adopt. Review field changes before upgrading dashboards or collectors, and clearly distinguish custom application fields from standardized attributes.
Record Routing and Recovery Decisions
An operation’s final model is only part of the explanation.
To investigate a routing or fallback change, retain:
-
Requested model and required capability set.
-
Routing and recovery policy versions.
-
Selected candidate and decision reason.
-
Exclusion reasons where useful.
-
Triggering failure for each recovery attempt.
-
Reported serving information when available.
-
The attempt selected for publication.
This makes it possible to answer whether a problem began with initial selection, provider execution, recovery, or output handling.
Keep the record proportional to the need. A policy snapshot reference and reason codes may be more practical than copying a large candidate catalog into every log event.
Also distinguish application-visible attempts from internal upstream retries you cannot observe. Missing upstream detail should remain an explicit visibility limit.
Token360’s Routing and Reliability documentation identifies available correlation signals and explains that an unpinned public model name does not necessarily identify a fixed upstream provider.
Connect Technical Success to Product Quality
Availability describes whether the system responds. Product quality describes whether the response achieves the intended task.
Choose outcome signals that match the workload.
Record the evaluation method and version. A rule-based validator, human review, and model-based evaluator measure different things.
If an evaluator receives prompts or outputs, include it in the approved data path. Its own latency and cost also belong in the evaluation of the system.
Use production feedback to identify changes worth investigating, then validate them with representative evaluation data.
A faster route with more regenerations may deliver a worse experience despite an improved latency chart.
Attribute Usage Without Confusing It With a Financial Ledger
Observability should connect resource consumption to the operation that caused it.
Retain units and provenance:
-
Input and output tokens.
-
Generated image count.
-
Audio or video duration.
-
Model-specific billing components.
-
Whether a value is estimated, measured, pending, or settled.
Do not put different units into a single unlabeled usage total.
Associate all relevant attempts with the operation, including attempts whose outputs were discarded. Deduplicate repeated usage observations rather than counting the same charge each time it appears in a response, callback, or reconciliation result.
A useful analytical measure is:
Cost per accepted outcome = attributed spend for a defined operation cohort ÷ accepted outcomes in that cohort.
Use a coherent cohort and account for pending settlement. Comparing today’s charges with today’s completions can mislead when long-running operations cross reporting boundaries.
Token360’s Billing and Usage documentation distinguishes estimates from final charges and provides request-level reconciliation. It also notes that asynchronous billing can settle after the generation reaches a terminal state.
Detailed ledger design, budget enforcement, and cost allocation belong in AI API Cost Management.
Set a Content Logging Policy
Useful observability does not require routine storage of every prompt and output.
Start with metadata: identifiers, timestamps, state changes, model selection, usage, and sanitized errors.
When content capture is necessary, define its purpose, permitted data categories, access controls, sampling, retention, and deletion process.
Common leakage points include:
-
Authorization headers and API keys.
-
Signed asset URLs.
-
Tool arguments and results.
-
Provider error bodies containing input fragments.
-
Exception messages.
-
Trace attributes or propagated baggage.
-
Debug logging enabled by an SDK.
Redact before export where possible. Review automatic instrumentation settings rather than assuming they follow your intended content policy.
Sampling reduces volume; it does not remove sensitivity. A small sample can still contain credentials or confidential information.
Store approved diagnostic content separately when it requires stricter access than ordinary operational metadata.
Investigate One Stalled Job End to End
Consider a hypothetical video operation that remains “processing” even though the provider has completed it.
Start with the internal operation ID.
Suppose the upstream job is complete, but asset retrieval repeatedly fails. The next action is to investigate or recover the asset, not automatically create another generation.
If evidence is missing, mark the boundary unknown. Absence of a callback log does not prove that no callback was sent; it could reflect delivery failure, processing failure, or dropped telemetry.
Turn each investigation into an instrumentation improvement at the missing boundary.
Keep Dashboards and Alerts Useful During Failure
A dashboard can appear healthier when the slowest work disappears from its calculations.
Show completed-operation latency alongside timed-out counts, unresolved counts, and pending-job age.
Define success-rate denominators explicitly. A cohort-based view can track all operations admitted during a period and show their outcomes after a defined observation window. Keep newer pending work visible rather than silently treating it as complete or excluding it without explanation.
Separate synthetic checks, internal experiments, and customer traffic.
Do not average P95 values from separate instances to produce a supposed global P95. Use compatible aggregated distributions or an appropriate centralized calculation.
Alert on actionable symptoms
Start with a small set of alerts:
-
An unusual rise in deadline misses or failed operations.
-
Pending jobs exceeding their expected age.
-
A sustained increase in fallback activity.
-
Completed generations failing asset preparation.
-
Growing usage-reconciliation backlog.
-
Telemetry export failures that reduce visibility.
Each alert should have an owner, a defined workload scope, and a runbook.
Thresholds should reflect workload expectations and sufficient traffic volume. One slow request in a low-volume test environment should not necessarily page the same team as a widespread customer-facing failure.
Where Token360 Fits
Use Token360’s request identifiers, available response metadata, routing documentation, and billing records as upstream evidence.
Keep your internal operation record responsible for the full product lifecycle, including application queues, validation, asset storage, and customer-visible completion.
Begin with the Token360 overview, then connect the documented routing and usage signals to one application operation.
Do not assume that a gateway can observe every downstream action in your product or expose every internal provider timing boundary.
The useful integration is the join between those sources.
Implementation Checklist
Before relying on an AI observability dashboard:
-
Assign a stable internal operation ID.
-
Separate operations, attempts, jobs, and trace identities.
-
Define each latency boundary and its source.
-
Preserve unknown values instead of inventing precision.
-
Record routing and recovery policy versions.
-
Keep metric dimensions bounded.
-
Maintain durable state independently of sampled traces.
-
Distinguish technical completion, output readiness, and quality acceptance.
-
Attribute usage across all attempts without double-counting.
-
Apply a documented content logging policy.
-
Include unresolved and timed-out work in operational views.
-
Test one investigation from customer report to final outcome.
Frequently Asked Questions
How is AI API observability different from API monitoring?
It adds model and routing context, asynchronous job state, modality-specific usage, and product-quality signals to conventional request monitoring.
What is the most useful AI metric?
There is no single metric for every workload. Pair customer-visible completion and latency with an acceptance measure, then examine resource usage and recovery behavior.
Should prompts and outputs be logged?
Only when there is a defined need and an approved policy for access, retention, sampling, and sensitive content. Metadata should support routine investigation wherever possible.
Can one trace represent a long-running AI job?
Sometimes, but the application should not depend on one continuous trace. Durable operation records and linked execution spans can preserve the relationship across processes and delays.
Can queue time and generation time always be measured separately?
No. Separate them only when the relevant events are observable. Otherwise, use an accurately labeled combined interval.
Is HTTP 200 a sufficient success signal?
No. It may indicate acceptance or transport success while processing, validation, retrieval, or customer delivery remains incomplete.
Does a regeneration mean the first output was bad?
Not necessarily. Users may be exploring alternatives. Interpret regeneration alongside workload context and explicit quality evaluation.
Can sampled traces provide the complete billing record?
No. Sampling can omit billable work. Use authoritative usage and billing records for reconciliation.
What to Read Next
Start With One Investigable Customer Operation
Choose a representative operation and confirm that you can connect its submission, model attempts, processing state, output, usage, and final product outcome.
Fill the missing links before adding more dashboards.
Review Token360 usage and model documentation.


 Tutorial
 Tutorial
 Prompt Guide