AI API Cold Start vs Queue Time: Why Requests Start Late
Cold starts prepare a worker; queues hold work waiting for capacity. Learn what request timings can prove and how to investigate a slow first response.
AI API OPERATIONS · BLOG 157
By Token360 · Editorial review: November 5, 2026
A cold start prepares a serving worker before it can execute work. Queue time is the interval a request waits for an execution opportunity. Both can delay an AI response, and they can overlap. A slow first request is an observation—not enough evidence to identify either cause without service-side timing or corroborating records.
When the first video generation takes longer than the next, calling it a cold start can feel like an explanation. It may only rename the symptom. The same pattern can involve connection setup, different workloads, cache behavior, routing or queue conditions. Buying a different service arrangement before distinguishing these possibilities can leave the actual delay untouched.
This article is a diagnosis framework for teams using Token360 and other hosted AI APIs. It includes hypothetical timing examples and a blank observation worksheet. It does not report a Token360 cold-start benchmark, reveal hidden worker state or promise that a particular capacity arrangement removes all waiting.
Read first: Token360’s timeout and retry guidance provides the operational context for delayed requests. The question here is what evidence supports a cause, rather than how to implement a general-purpose latency timer.
What is the difference between a cold start and queue time?
A cold start concerns the readiness of an execution worker; queue time concerns the waiting request. A request can wait while a worker starts, or wait behind other work on an already running worker. Record which event each metric measures before comparing values, because these intervals are not necessarily separate, additive components.
Dimension
Cold start
Queue time
Core question
Was a worker ready to execute?
When did this request get an execution slot?
Relevant evidence
Worker initialization and readiness events.
Request enqueue and dequeue/start events.
Possible setting
A new or restarted serving worker.
Demand waiting on scheduling or available capacity.
Can it occur with other delay?
Yes; requests may be queued during startup.
Yes; waiting can include time spent starting capacity.
Client-only conclusion
Usually a hypothesis without additional evidence.
A reported queued state may identify waiting, but not its complete cause.
Google Cloud’s guide to AI cold starts, published May 27, 2026, describes infrastructure, container and model-loading stages in its Cloud Run context. This illustrates why preparation can precede inference. It does not establish that every hosted AI API uses Cloud Run or exposes the same phases.
Keep the terminology tied to evidence. “The client observed a long wait before the first output” is defensible from client timing. “The model took that entire interval to load” requires information about model loading.
Why does a slower first request not prove a cold start?
A slower first request is compatible with several explanations. The next request may reuse a connection, reach another route, encounter less traffic or contain a different workload. Repetition establishes a pattern only when the comparison is sufficiently controlled; identifying the mechanism still requires evidence beyond the order in which requests were sent.
For an initial comparison, keep the model, endpoint, input, output settings, client location and concurrency fixed. Record whether the client reused its connection and whether any cache or route information was actually returned. If those fields are not observable, mark them unknown rather than assuming that all conditions matched.
An idle interval in your application is not proof that a shared upstream worker became idle. Other customers may be using it, and a later request may reach a different worker. Likewise, two calls close together are not guaranteed to use the same worker. Describe your experiment as “first call after an application idle interval,” not “confirmed cold worker,” unless the service evidence supports the latter.
A useful report separates the observation from the hypothesis: “Call A completed later than Call B; initialization is one possible explanation; worker lifecycle data was unavailable.” That is more actionable than a chart labelled cold versus warm solely from request sequence.
Can client timing separate startup, queueing and inference?
Client timing measures events visible to the client, not every internal stage. It can identify submission duration, first output and completion, but cannot automatically split a hidden interval into startup, queueing and execution. Use service timestamps when available, understand their definitions, and avoid subtracting numbers that refer to different clocks or overlapping stages.
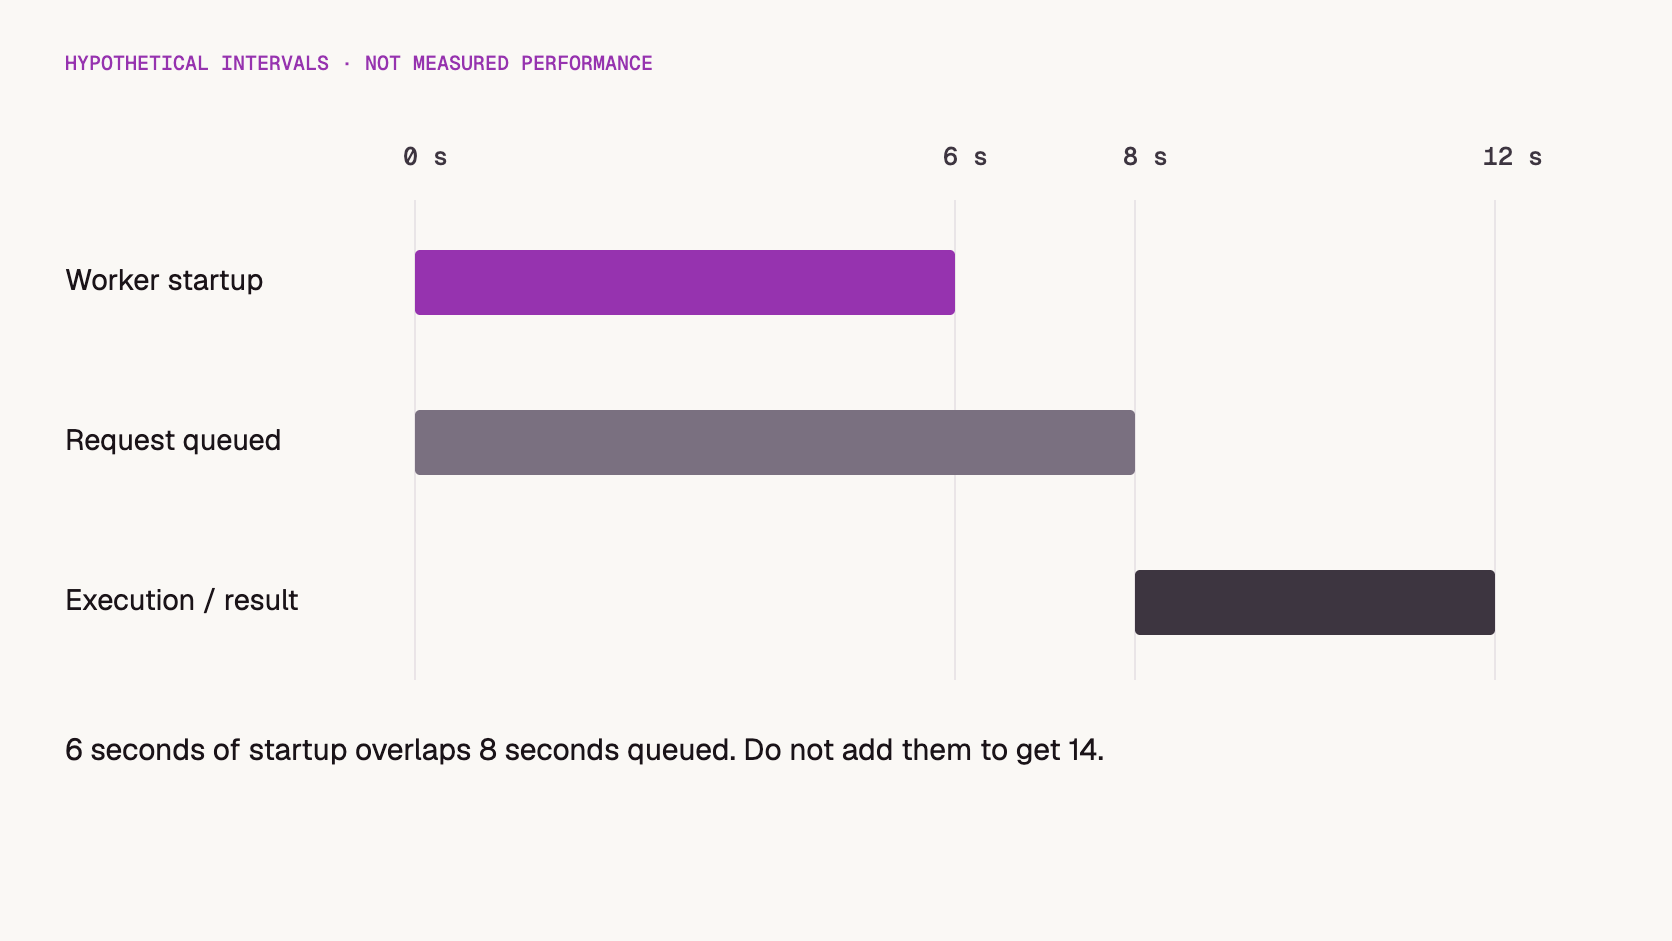
Hypothetical example: a client records submission at 12:00:00 and receives a result at 12:00:12. The twelve-second interval could contain several combinations of network time, waiting, initialization, inference and delivery. The total alone does not identify the mix.
Additional evidence in a hypothetical record
Supported interpretation
Still not established
Request queued from 12:00:00 to 12:00:08.
The service reports eight seconds in its queue interval.
Whether startup explains any of that wait.
Worker initialized from 12:00:00 to 12:00:06; request dequeued at 12:00:08.
Startup overlapped the reported waiting interval.
Fourteen seconds of pre-execution delay; adding six and eight would double-count overlap.
Only a twelve-second client total.
End-to-end time for this observation.
A confirmed cold start or queue duration.
Hypothetical intervals, not Token360 measurements. Overlapping durations must not be added as if they were separate stages.
For asynchronous media, polling introduces another distinction: the first time your client observes completion can be later than the actual completion event. Preserve a documented service timestamp if provided and label the client observation separately. Do not describe the whole polling interval as inference time.
How should a team investigate the pattern without overstating the result?
Start with a bounded comparison designed to separate observations, then ask for missing evidence. Compare like workloads at low concurrency before examining a controlled burst within approved limits. Keep unsuccessful requests and unknown fields in the record. The goal is a defensible diagnosis, not a dramatic fastest-versus-slowest pair selected after the test.
Copy blog157-startup-queue-observations.csv:
Request ID,UTC timestamp,Model/endpoint,Settings/input reference,Client location,Application concurrency,Application idle interval,Connection reused/unknown,Submit duration,First output time,Completion observation,Service queue interval/unknown,Worker startup interval/unknown,Route/cache evidence or unknown,Status/error,Billing unit and recorded charge,Observation,Hypothesis,Evidence needed
,,,,,,,,,,,,,,,,,,
. It records conditions, client events, any documented service intervals and the evidence supporting the final interpretation. It contains no prefilled measurements and is not a completed benchmark.
Define the question. For example, investigate repeated delays before the first output, not every form of application latency at once.
Hold the workload stable. Retain the model and relevant generation settings. Record changes rather than silently combining them.
Separate observation groups. Label first-after-idle and subsequent calls as client-side conditions. Do not rename them cold and warm without worker evidence.
Record load. Note application concurrency and known queue state. Your concurrency is not the service’s total load.
Retain failures. Include timeouts and incomplete jobs as such; excluding them makes the comparison incomplete.
Request corroboration. Ask whether the supplied request IDs correspond to initialization or queue events that the operator can confirm.
Agree the test scope and cost budget before running a burst. This article has not performed one. Where the platform does not expose worker-level measurements, the result can legitimately remain “cause unresolved.” A useful unresolved result lists the missing evidence and the next owner.
Does waiting time count toward the API charge?
Billing depends on the selected product’s meter and terms, not the duration visible on your stopwatch. A long wait does not automatically mean a larger charge, and a short response does not establish a lower one. Distinguish a managed model API from a worker-based compute product before applying any provider’s billing explanation.
The fal FAQ, checked November 5, 2026, says that its Model API endpoints do not charge cold-start time, including container pull and model loading. That product-specific answer prompted this article. It should not be transferred to every fal product or to another platform.
For contrast, Runpod’s worker lifecycle documentation, checked November 5, 2026, describes billing while a worker is running, including cold start, processing and waiting during its idle timeout. This is a different product boundary, not evidence that one provider is universally cheaper.
Token360’s billing documentation, checked November 5, 2026, directs users to the selected model’s pricing rules and distinguishes estimates from final measured charges. Model meters can differ. Reconcile the request’s recorded charge instead of multiplying client-observed seconds by an assumed compute rate.
For example, an output-duration meter and an elapsed-compute-time meter answer different questions. A video’s duration is not the same quantity as the time you waited for it. Keep the billing unit, quantity and charge alongside—not merged into—the latency record.
Which response fits the evidence?
Choose a mitigation only after identifying the layer you can influence. Verified initialization delay suggests reviewing readiness or startup arrangements; sustained queue growth suggests reviewing demand and available execution capacity. Unresolved client-side delay calls for more diagnosis. An intervention should be evaluated against the same workload, and any cost or coverage tradeoff should remain explicit.
Evidence
Reasonable next discussion
Limit
Confirmed worker initialization delay
Readiness, lifecycle and startup options with the operator.
Customer control and availability depend on the product.
Queue growth during a known application burst
Admission pacing and workload/capacity alignment.
A higher request limit alone is not more execution capacity.
Longer execution for larger inputs
Workload size and model-specific processing behavior.
Not evidence of a cold start.
Long first-output delay without service details
Collect correlated records and investigate.
Do not promise a warm-worker fix.
Automatic keep-alive requests are not a universal answer. They create additional work and may not reach the worker that handles the next real request. Unless a documented arrangement gives the behavior you need, treat them as an unverified intervention rather than a production guarantee.
DigitalOcean’s burst-traffic discussion, checked November 5, 2026, emphasizes queue visibility and distinguishing application arrival from inference submission. It reinforces the value of locating where waiting occurs before treating every delayed first token as slow model execution.
What should Token360 users send for investigation?
Send a small set of correlated examples with the conditions and timestamps needed to distinguish the pattern. Ask what can be confirmed about those requests rather than asserting an upstream cause. Include both the slow observation and a comparable ordinary one, preserve their identifiers, and state which service-side measurements were unavailable to your team.
Token360’s support guidance asks for the UTC time range, public model, endpoint, status and error code, request ID and trace ID, with secrets and unnecessary sensitive material removed. Add the observed timing boundary and application concurrency so the question is specific.
A concise investigation note might say: “These requests used the same model and settings. The first output was delayed in the attached observations. We recorded client timestamps, but do not have worker initialization or queue timing. Can you confirm whether either explains the delay for these IDs?” This is a proposed report format, not a promise that every internal timestamp will be disclosed.
These answers separate observable timing from inferred causes and commercial terms. They do not establish Token360 worker behavior or a universal provider billing rule. Use the selected endpoint’s documentation, confirmed request records and applicable account arrangement. Where internal stages are not visible, keep the diagnosis qualified instead of filling the gap with assumptions.
Is every slow first request a cold start?
No. Request order alone does not establish worker initialization. Connection reuse, workload, route and queue conditions can complicate the comparison.
Can cold start and queue time overlap?
Yes. A request may remain queued while a worker starts. Adding both intervals can double-count elapsed time.
Does faster polling make generation start earlier?
Do not assume so. Polling observes job state. A shorter polling interval may reveal a completed result sooner without changing when execution started.
Does dedicated capacity guarantee zero waiting?
No such guarantee follows from the label alone. Confirm the actual readiness, capacity and workload commitments in the applicable arrangement.
Are the twelve-second examples Token360 results?
No. They are hypothetical illustrations of timing boundaries and overlap, not live measurements.
Developer Guide
API
Build faster with one AI API.
Use Token360 to call video, image, audio, and text models with one key and one bill.


 Guides
 Guides
 Guides