How to Measure AI API Latency: TTFT, Total Time, and Async Job Wait
Measure AI API latency with clear boundaries for TTFT, total response time, and async job wait. Learn from nine manual timings and one curl observation.
“This model took two seconds” is incomplete evidence. Two seconds until the first response byte, the first useful text, the completed response, or the downloaded media file are different measurements. A reliable latency test starts by defining the interval, not by choosing a stopwatch.
Quick answer: record explicit start and finish events, use a monotonic timer for elapsed time, and keep first-content latency, request completion, and asynchronous job wait separate. Compare only equivalent workloads and measurement boundaries. Publish sample size, failures, timeouts, and individual observations alongside summary statistics.
This guide reanalyzes nine tester-supplied music-generation timings and a successful non-streaming curl request from our earlier work. It does not introduce a new benchmark, claim a provider ranking, or estimate production p95 from a small pilot.
1. Name the start and finish of every latency metric
The useful metric depends on the product. A chat interface needs to know when meaningful content first appears. A report generator may care most about receiving a complete valid response. A video workflow can return a job ID quickly and still make the user wait minutes for a usable file.
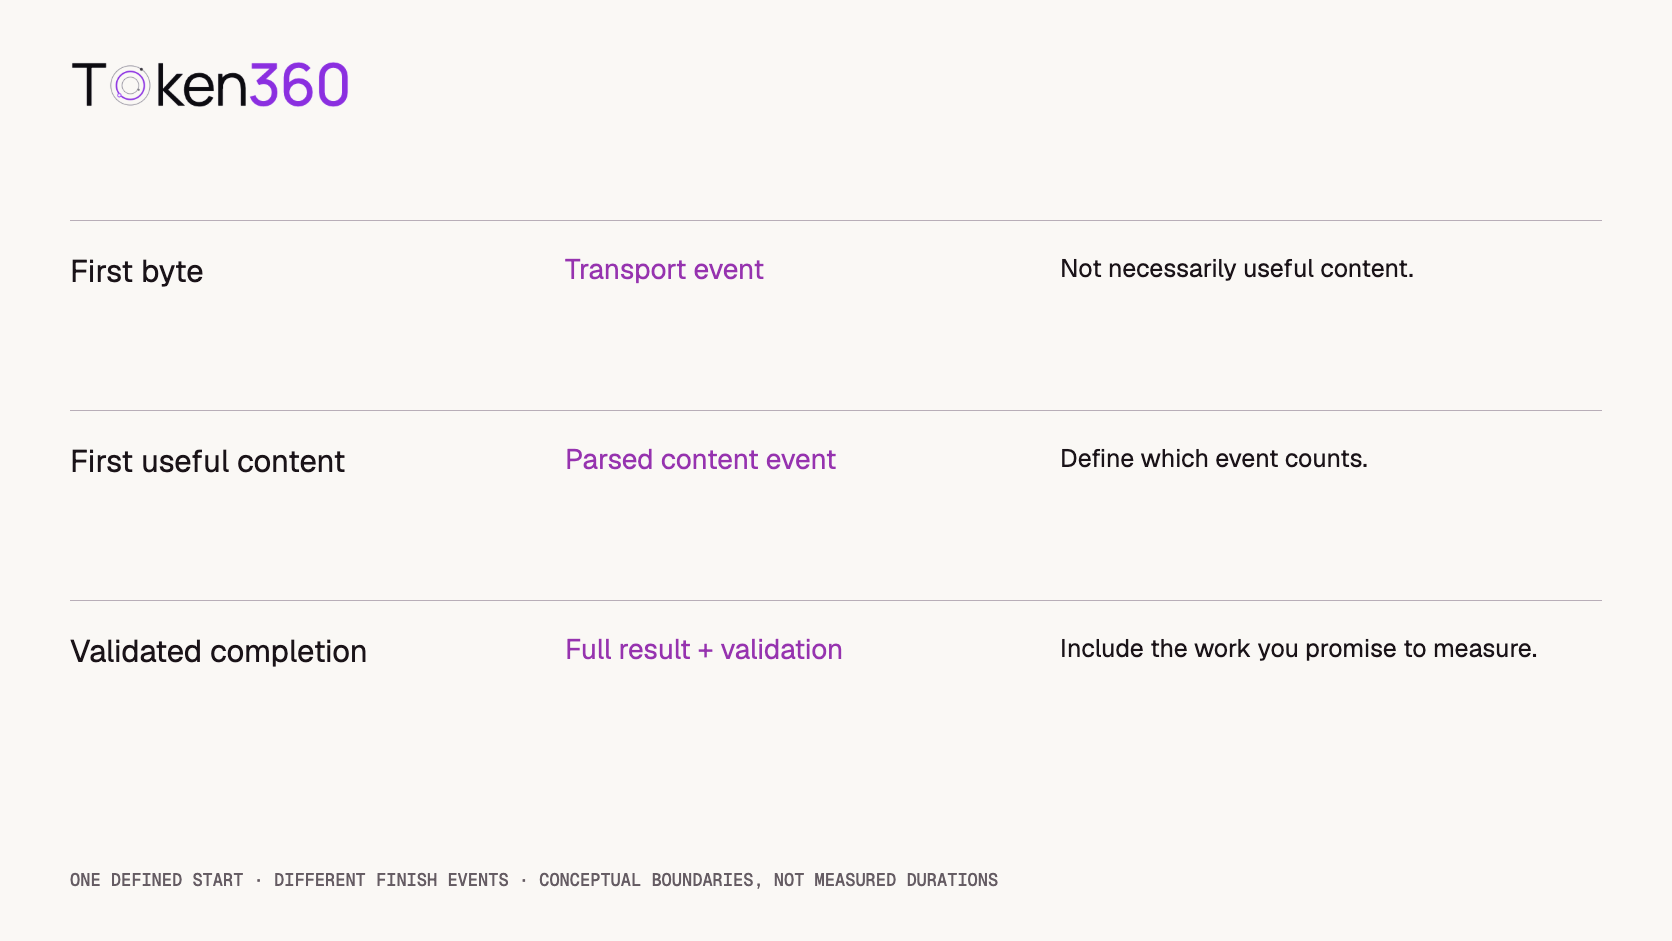
Metric
Suggested boundary
Important limitation
Time to first byte
Client transfer start → first received byte
The byte may belong to headers or metadata.
Time to first useful content
Application submission → first parsed content delta
Define which events count; do not count a heartbeat.
Complete response time
Application submission → complete response received and validated
Includes more than model computation.
Async completion observed
Submission → client observes a terminal job state
May include queueing and polling delay.
Asset ready for use
User action → downloaded or persisted asset passes validation
Includes delivery work after generation.
Teams often call first-content latency “TTFT,” or time to first token. When a protocol returns text chunks rather than individual token events, label the implementation precisely: the timer observes the first useful chunk, not an independently measured internal token-generation event.
Choose one boundary as the main product metric and preserve the others for diagnosis. Avoid combining application-level durations with provider-only durations in a single unlabeled chart. A timer includes only the operations between its start and finish, regardless of how its column is named.
2. Use a monotonic timer and retain wall-clock context
Use a monotonic elapsed-time source inside the client process. Keep a separate UTC timestamp for correlating the observation with logs. Subtracting wall-clock timestamps across machines can introduce clock differences; it does not automatically reveal network or queue time.
Python’s time.perf_counter documentation describes a high-resolution performance counter intended for short-duration measurement. Its absolute value is not a timestamp; differences between readings provide the elapsed interval.
# Illustrative instrumentation, not a Token360 client implementation.
from time import perf_counter

started = perf_counter()
first_content_seconds = None

for event in stream_events():
    if is_useful_content(event) and first_content_seconds is None:
        first_content_seconds = perf_counter() - started
    process_event(event)

validate_terminal_event()
completed_seconds = perf_counter() - started
The three helper functions above represent your actual protocol parser and application validation. They are not provided SDK functions. A production implementation also records exceptions, incomplete streams, and the elapsed time at failure. It should not convert an interrupted stream into a successful completion simply because the loop ended.
Place the start event before the operation you intend to measure. Starting after the request body has uploaded excludes upload time. Ending before response validation excludes that work. Both can be legitimate diagnostic metrics, but neither should silently replace the full user-visible interval.
3. Understand what curl can and cannot establish
curl exposes useful transfer timings through --write-out. Its official manual defines time_starttransfer as elapsed time until the first byte arrives and time_total as the duration of the full operation. These are client-observed transfer metrics, not direct model execution timers. See the curl write-out reference.
For an existing authorized request, a timing suffix can look like this:
This is an option fragment to add to your request, not a standalone command. Retain the response body and relevant status so a fast error is not mistaken for a fast successful result. Do not publish authorization headers or credentials with the timing record.
One earlier tester-provided curl screenshot showed a successful non-streaming request to /v1/chat/completions, requesting model ID gpt-6.1-sol. The prompt asked for exactly READY, and the response returned it.
Observed field
Recorded value
HTTP status
200
curl time_total
2.165453 seconds
Input / output / total tokens
13 / 5 / 18
Streaming
false
First-content time
Not measured
Evidence
User-supplied terminal screenshot; one request
A separate Playground screenshot displayed 1.99 seconds with 23 input tokens and 5 output tokens. Those are different observations with different input counts, and the displayed Playground timer’s exact boundary was not established. Subtracting them cannot isolate gateway overhead, SDK overhead, or a performance improvement.
Conceptual boundaries, not a measured timeline or a fixed ordering for every protocol.
4. Measure asynchronous jobs beyond the submission response
For audio or video jobs, record submission time, acknowledgement time, observed terminal state, and asset-ready time separately. A fast acknowledgement measures acceptance of work, not completion of generation.
When polling, the client learns about completion at a later observation. If the job finishes between polls, some of the reported wait is discovery delay. Do not subtract a guessed half-polling interval and present the remainder as measured processing time. Exact separation requires appropriate provider timestamps and a clear understanding of what they represent.
A webhook can also arrive after processing ends. Record both the event’s reported timestamp and your receipt timestamp where available, while retaining the uncertainty from different clocks. Neither polling nor a callback alone guarantees a view of internal queue and compute phases.
Token360’s timeout and retry guidance distinguishes connection and overall timeouts, and recommends treating asynchronous submission separately from subsequent resource polling. It also cautions that a client timeout does not prove upstream work never started.
5. Worked example: nine manually timed music generations
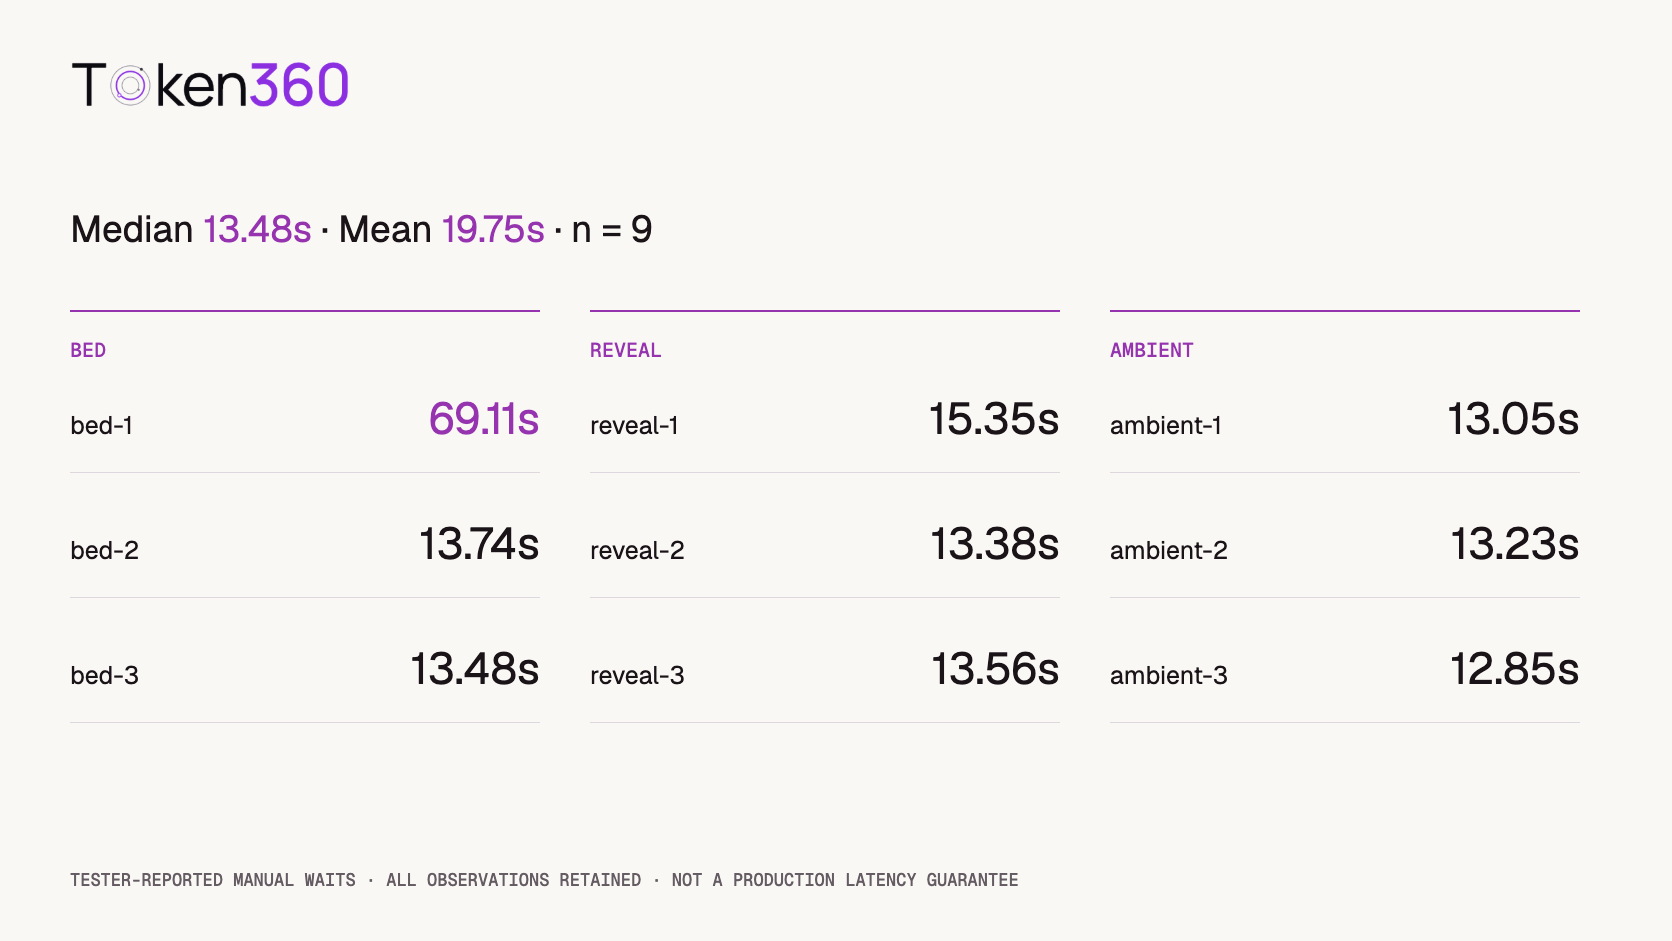
The tester supplied the following elapsed waits for the Sonilo music pilot and confirmed that all were manually timed. Three briefs were run three times each. The intended task was submission-to-observed-completion timing, but no instrumented start and finish events were captured. The hundredths below preserve the submitted readings; they do not imply hundredth-of-a-second measurement accuracy.
Sample
Reported wait, seconds
Method
bed-1
69.11
Manual
bed-2
13.74
Manual
bed-3
13.48
Manual
reveal-1
15.35
Manual
reveal-2
13.38
Manual
reveal-3
13.56
Manual
ambient-1
13.05
Manual
ambient-2
13.23
Manual
ambient-3
12.85
Manual
Number of observations: 9
Sum of reported waits: 177.75 seconds
Mean:   177.75 / 9 = 19.75 seconds
Median: 13.48 seconds
Range:  12.85–69.11 seconds
The mean and median describe different aspects of this small set. The median locates the middle observation. The mean includes the contribution of the long wait and is substantially higher. Keep both rather than selecting whichever makes the service look faster.
Excluding bed-1 would produce a mean of 13.58 seconds for the remaining eight observations. That is a sensitivity calculation, not the headline result. We have no evidence that the long wait was a measurement error or that it was caused by a cold start. Its position as the first listed run is not sufficient to establish the cause.
These records support a description of this pilot. They do not establish a stable production distribution, a general speed advantage, or guaranteed wait time. The sample spans three different briefs and was not a controlled comparison with another model.
Tester-reported manual waits. All observations retained; no new generation tests performed.
6. Keep failures and workload differences in the report
For each attempt, retain the requested model, endpoint, input size, output length, streaming mode, concurrency, client version, and outcome. For media, include output duration and resolution. A ten-token response and a long structured response are not equivalent workloads merely because they use the same model.
Document connection reuse and test location if they matter to the comparison. Interleave comparable runs across routes where practical so one route is not tested only during a quieter period. Confirm actual output validity as well as speed: a fast malformed response is not a successful completion.
Report attempted, completed, failed, and timed-out counts. Keep timeout durations as timeout observations, not completed-generation durations. A success-only latency summary is acceptable if explicitly labeled and accompanied by the excluded outcomes.
Track both attempt-level and logical-task latency when retries occur. Users experience the initial wait, backoff, and retry together. A retry’s short successful duration does not describe the total wait for that user action.
For percentiles, specify the estimator and observation window. With nine samples, a nearest-rank p95 selects the largest observation; other interpolation methods can return another value. That numerical output does not make the pilot a robust estimate of production tail latency. Collect repeated representative observations across relevant conditions before using a tail estimate for capacity or product commitments.
7. Publish a result that someone else can interpret
A useful latency statement includes the workload, measurement boundary, method, sample size, date window, outcome counts, and statistic. For our music pilot, a defensible summary is: “Nine tester-reported manual waits had a 13.48-second median and a 19.75-second mean; the longest was 69.11 seconds.”
For the text request, say: “One non-streaming curl request completed with HTTP 200 and time_total of 2.165453 seconds.” Do not relabel it TTFT. Keep the record precise without implying that one successful request predicts the next one.
Decide the next experiment from the uncertainty. If the problem is long user waits, instrument end-to-end delivery. If the problem is slow initial text, instrument parsed content events. If the problem appears only under load, vary concurrency within an approved budget and retain the failed attempts. Improving the measurement is more useful than adding decimal places to an ambiguous timer.
FAQ
Is curl time_starttransfer the same as TTFT?
No. It measures time until the first received byte. First useful text requires parsing the response and identifying a content event, which may occur later.
Can I compare Playground time with a curl result?
Only after establishing equivalent workloads and timer boundaries. Different token counts or unknown timer definitions prevent an apples-to-apples overhead calculation.
Is manual timing useless?
No. It can describe an observed user wait if the method and limitations are disclosed. It is weaker evidence for separating network, queue, compute, and rendering phases.
Should I remove the slowest run?
Not simply because it is slow. Retain it unless there is a documented exclusion reason. If you show a result without it, disclose both the full dataset and the reason.
Can nine runs establish p95 latency?
You can calculate a sample percentile, but nine observations do not support a stable production-tail claim. Report the sample, method, and uncertainty rather than treating the number as an SLA.
Does a request timeout mean generation stopped?
Not necessarily. Record the client timeout and reconcile remote state separately. A timed-out attempt is not a measured successful completion.
Next step: add explicit timing boundaries to one representative workflow and compare the resulting records with your current user-facing timer before expanding the test.
API
Video Generation
Developer Guide
Build faster with one AI API.
Use Token360 to call video, image, audio, and text models with one key and one bill.


 Tutorial
 Tutorial
 Tutorial